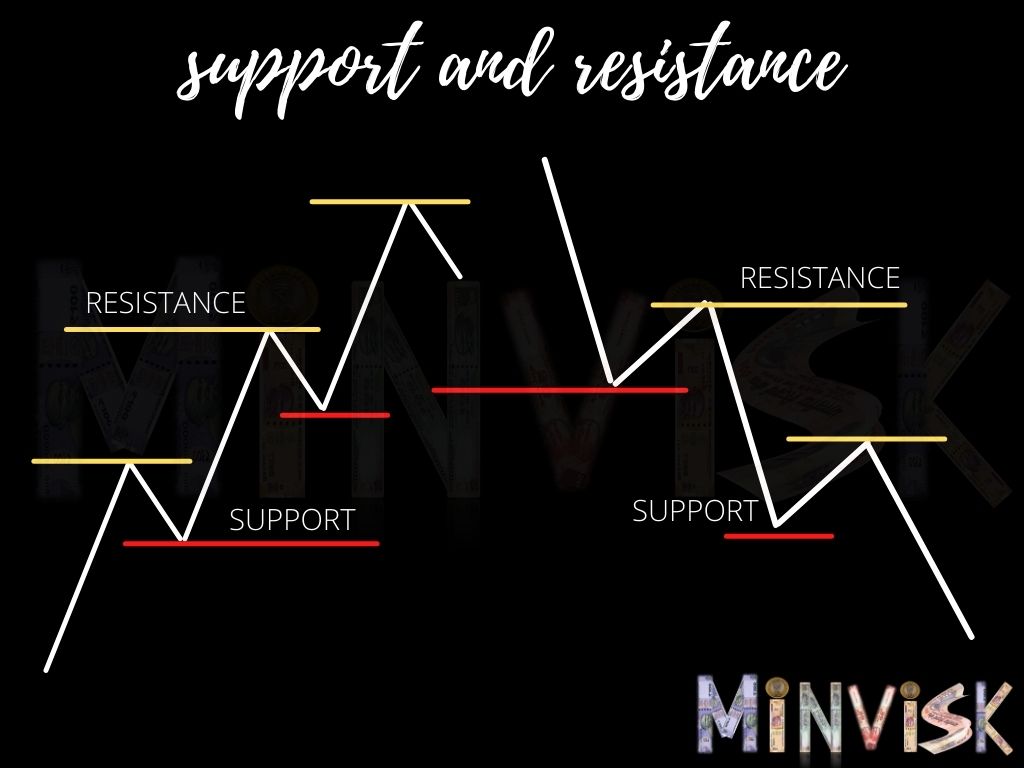
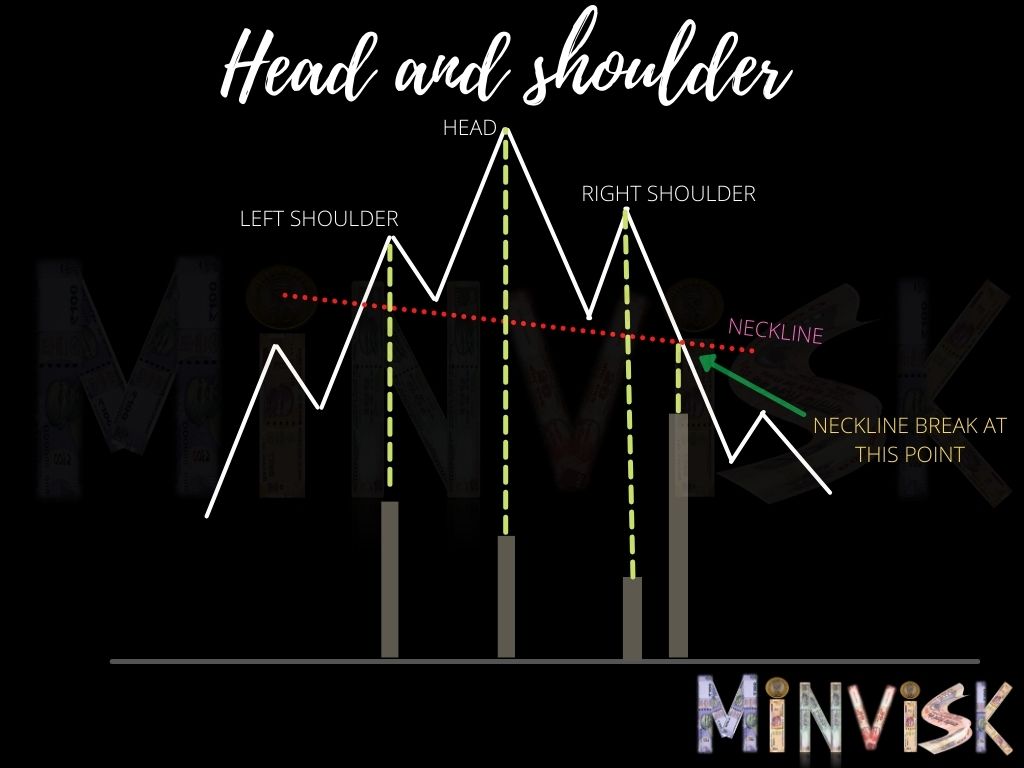
In technical analysis, a reversal pattern refers to a distinct chart formation that hints at a possible shift in the current trend. These patterns signify a change in market sentiment, suggesting that a sustained upward trend might be losing momentum, potentially paving the way for a shift to a downward trend, or vice versa. For traders and investors, recognizing reversal patterns is vital because they can offer early indications of impending changes in trends, creating opportunities for both profit and risk management.
There can be two types of uptrend reversal –
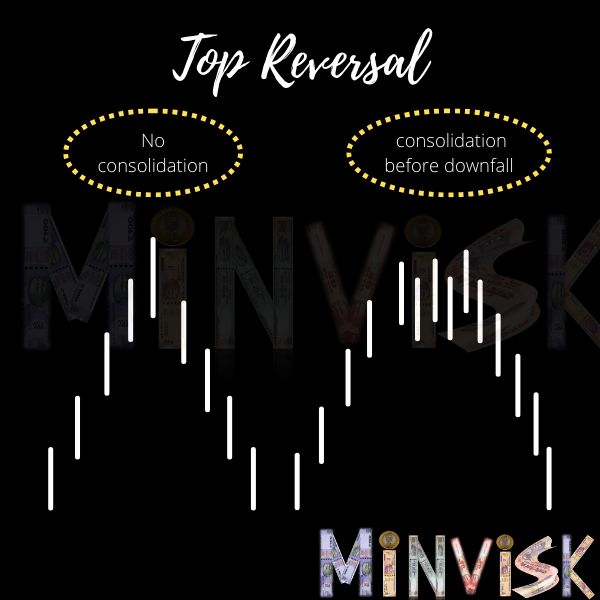
Top Reversal – A top reversal in technical analysis refers to a pattern or series of price movements that suggest a potential change in the prevailing trend from bullish (upward) to bearish (downward). Top reversal patterns typically occur after an extended uptrend and indicate that the buying momentum may be weakening, potentially leading to a reversal or a significant correction in prices. Here there will no sudden uptrend reversal and there will be consolidation (where market is stable or at rest) or markets will be at sideways before trend changes. There can be sudden uptrend reversal and there will be no consolidation before trend changes.
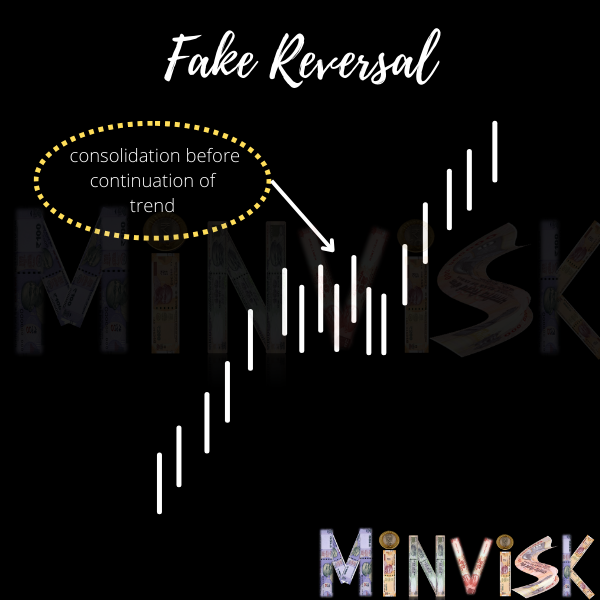
Fake Reversal – It is the situation where a price movement appears to be indicating a trend reversal, but the market ultimately continues in its original direction. It’s essentially a misleading signal that tricks traders into believing a reversal is underway when, in reality, it’s a temporary pause or retracement in the prevailing trend.
Remember, while reversal patterns provide valuable insights, no single pattern guarantees a trend reversal. Traders should use them as part of a comprehensive analysis and exercise caution, especially considering market conditions and other factors influencing price movements.

