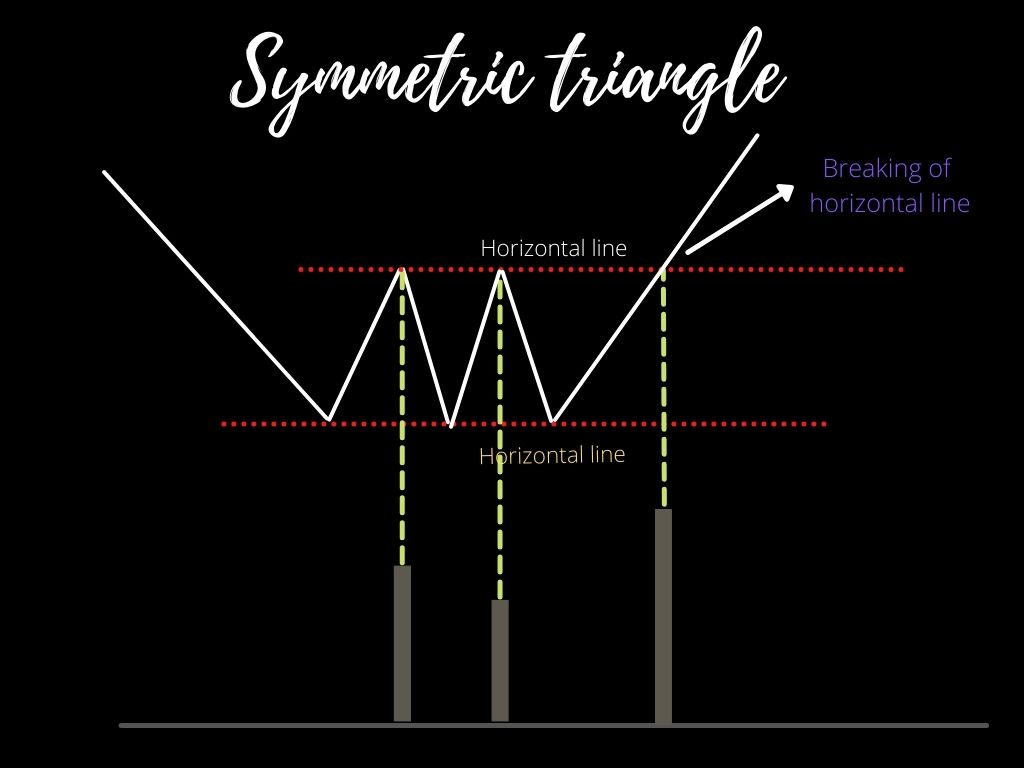
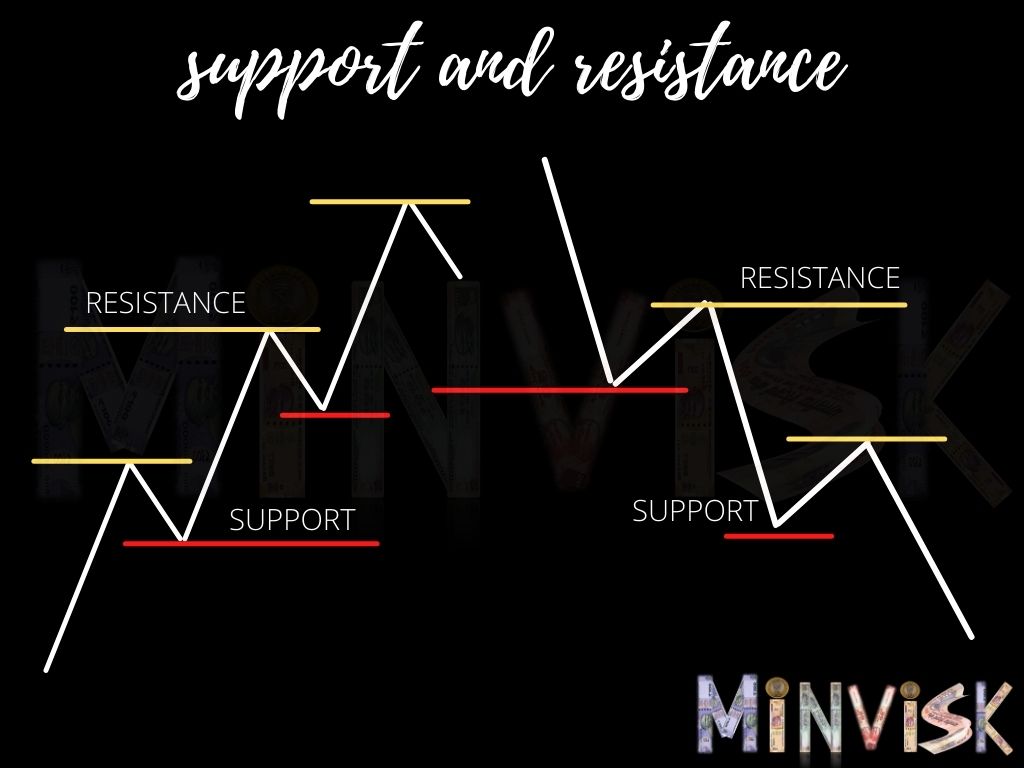
the symmetrical triangle is a continuation pattern during an uptrend. From the above image, we can see the shape of the triangle, it has two parts. The upper line acts as resistance and the lower line acts as support. This pattern consists of min 4 to 5 reversal points i.e it should have a minimum of 3 to 4 peak and troughs.
From our previous discussion, you might get the idea that volume is very important, therefore in this pattern, we will try to understand the volume. From the above image, we can see that volume keeps on decreasing on average as we continue with the chart and there is a sudden breakout of volume as a price break the upper line and when this happens our pattern is complete. Here we need to see that there is a tendency of volume to be high at bounces and low at troughs, this shows that buying pressure is greater than selling pressure.
To set the price target, draw the parallel line to the lower line from the upper tip of the upper line, it will give us the price range for our price objective.
This pattern is neutral, nor too bullish neither too much bearish, as it is more of a validation-type pattern that helps to determine the continuation of the trend.
This pattern is more significant on long-term charts i.e. weekly and monthly charts (less than 2 to 3 months) as compared to hourly charts.


in fact, at https://fielclimaavac.com/100-ways-bc-gamecom-can-make-you-invincible/ you get one free spin daily!