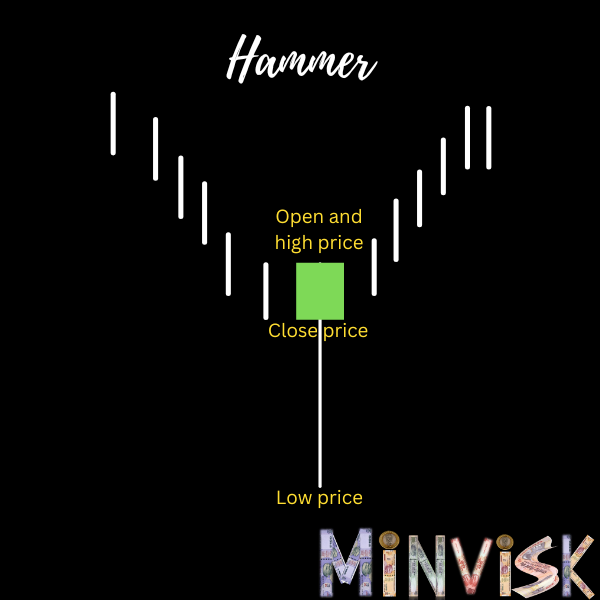
As we have discussed from the previous module, The hammer is a candlestick pattern that shows up when a downtrend might be turning around. Imagine a small candle with its top near the top, and a long tail hanging down, at least twice the size of the candle. This is the hammer, and it suggests a possible shift from a downtrend to an upward one. It is said hammer because it looks like hammer when it occurs during downtrend.
In theory, a green hammer is viewed as a ‘power line,’ but in practice, it has been observed that the color doesn’t play a significant role in this pattern. The Below image will make things clearer.

Below features of hammer which we have also discussed in the previous module (Umbrella lines) has been laid for your revision
Small Real Body: Small real body is located at the top of the candlestick. The color of the body is not as significant as its position in the overall pattern.
Long Lower Shadow (Wick): It has long lower shadow, which extends below the body. This shadow shows the difference between the lowest price and the closing price.
No or shorter Upper Shadow: The upper shadow, if present, is typically very short or non-existent.
Remember, although a hammer signals a potential shift in the market towards a bullish trend, it’s crucial to wait for confirmation through ongoing price movements. Traders usually watch for continued buying in the next few trading sessions to solidify the potential trend reversal. Always keep in mind that using additional technical indicators and considering various factors can give you a more complete picture of market conditions when analyzing candlestick patterns.
Psychology behind this pattern:
Long Lower Shadow (Wick): The long shadow indicates that Open price, close price and High price are very close to each other (same has also been shown in above diagram). This indicated weakness in people indecisiveness. The long lower shadow of the hammer suggests that market sold off during the session and sellers tried to push the price lower, but they were unsuccessful in maintaining those lower levels and buyers were in power and the price bounced back to close at or near the high price.
No or shorter Upper Shadow and small real body: The market closed off very high. This suggests that bears lost the fight and control over the price, as the market closed very near the high price. That’s why a small real body is relevant. The smaller the real body, the closer the closing price will be to the high price, and the more bullish the pattern will be.
How to Identify Support with Hammer Pattern
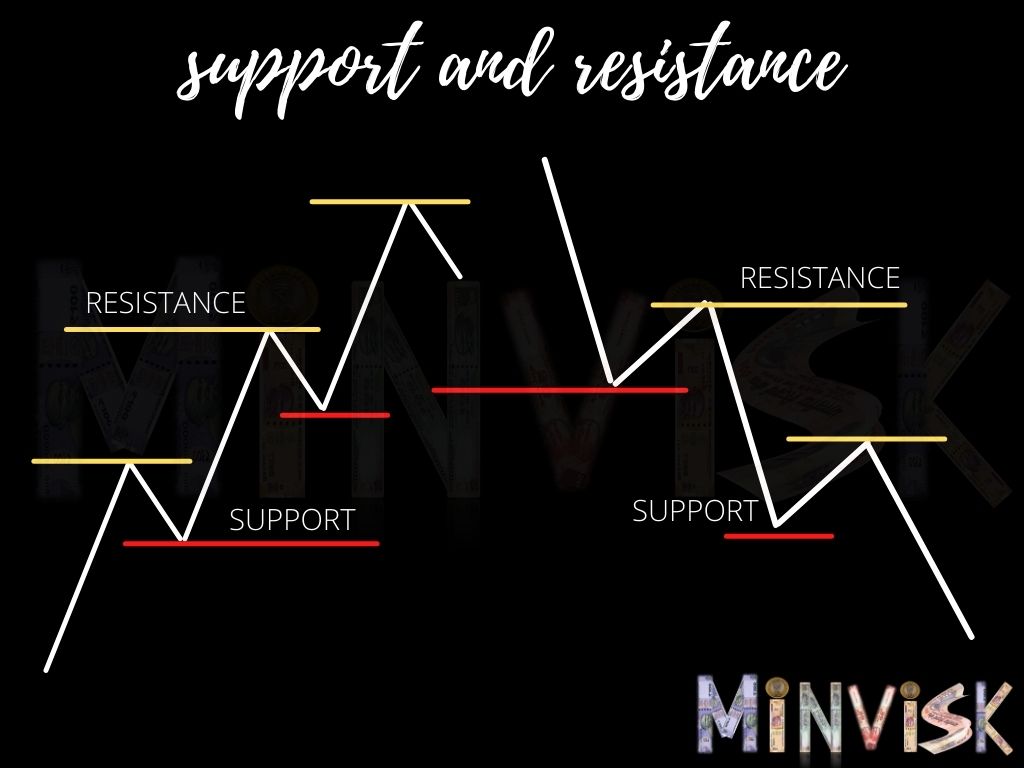
The lowest point or low price of the long lower shadow of the hammer can act as a potential support level as it indicates buyers’ interest and sellers losing their interest. It indicates that the price will not fall below it and if the price bounces off the support level formed by the hammer, it provides an additional confirmation that the pattern is meaningful.
The support level below the low of the hammer candle will work fine and it is considered as crucial support zone and if price falls below this price, this mean it is fake reversal and trend reversal will not likely to happen.
I hope you find it intriguing. In the next module, we will delve into the Hanging Man, a variation of umbrella lines.


