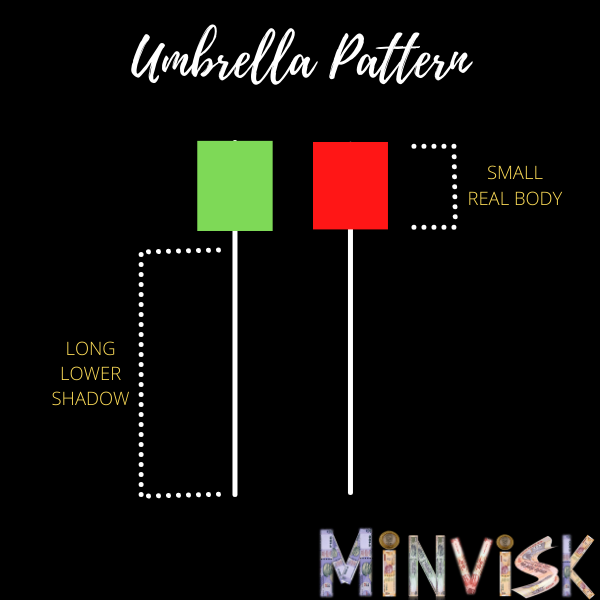
Umbrella lines play a crucial role as candlestick patterns for identifying trend reversals. When this pattern emerges during a downtrend, it is referred to as a hammer. Conversely, if it occurs in an uptrend, it is known as a hanging man. The pattern is characterized by a small real body (the area between the open and close prices) and a longer shadow extending downward. From the below image, we can reasonably conclude that why it’s known as umbrella lines because it look like one.

The presence of a small real body suggests weaker price action, indicating a potential trend reversal. The color of the real body is less significant, regardless of whether it occurs in an uptrend or downtrend.
Key characteristics of umbrella lines are outlined below:
- The real body should be at the upper end of the trading range. A smaller real body enhances the pattern’s strength.
- The shadow should be long, commonly recommended to be at least twice the length of the real body.
- While ideally having no upper shadow, if present, it should be very short to minimize its impact on the pattern.
Based on practical experience, it’s observed that a hanging man typically requires more confirmation compared to a hammer. In essence, a pattern becomes more meaningful and robust when the real body is smaller, and the lower shadow is longer.


