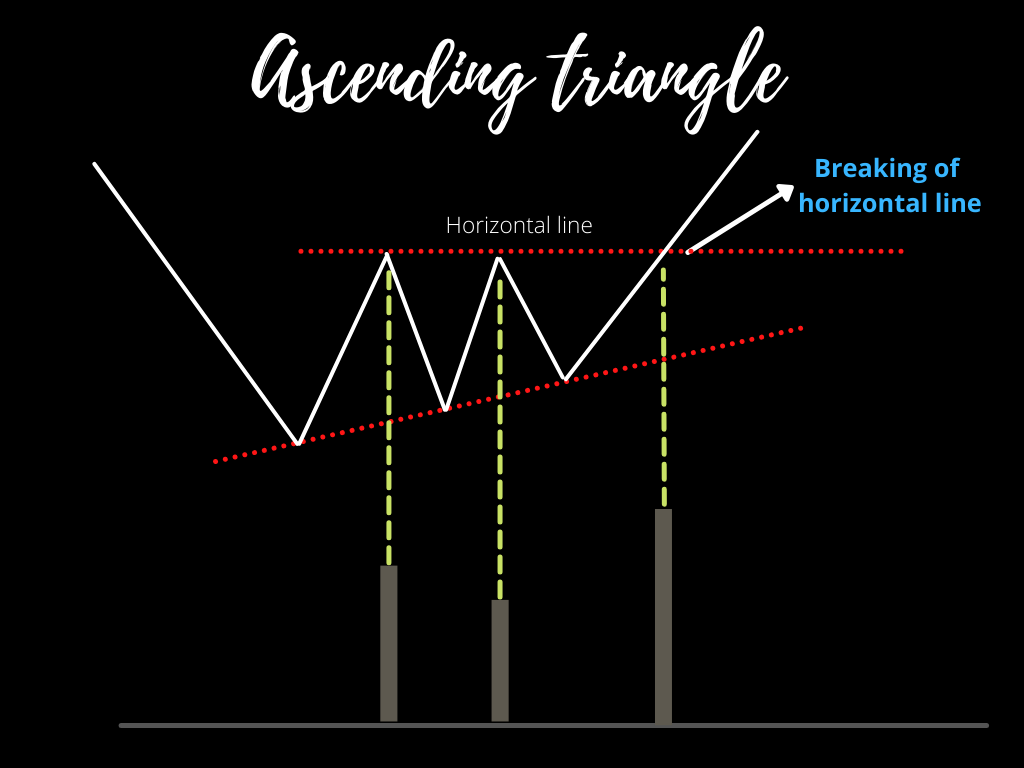
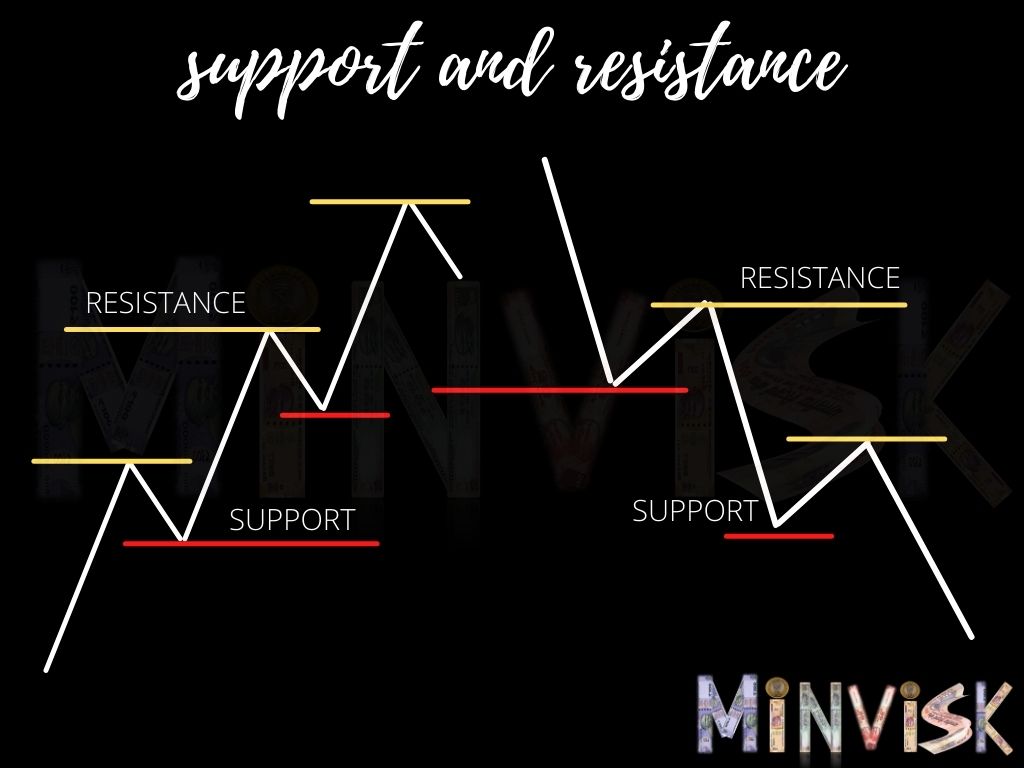
Understanding this pattern is not a big deal if we can understand the symmetrical triangle. It consists of two lines, the horizontal line which acts as resistance and, the lower line which is ascending, acts as support.
The volume acts in the same pattern as in the symmetrical triangle, volume keeps on decreasing on average as we continue with the chart and there is a sudden breakout of volume as a price break the horizontal line and when this happens our pattern is complete.
The main difference between symmetrical and ascending triangles is that this pattern is more bullish. In this pattern, buyers are more aggressive than sellers that’s why the lower line(support) keeps on increasing as buying pressure is more than selling pressure.


