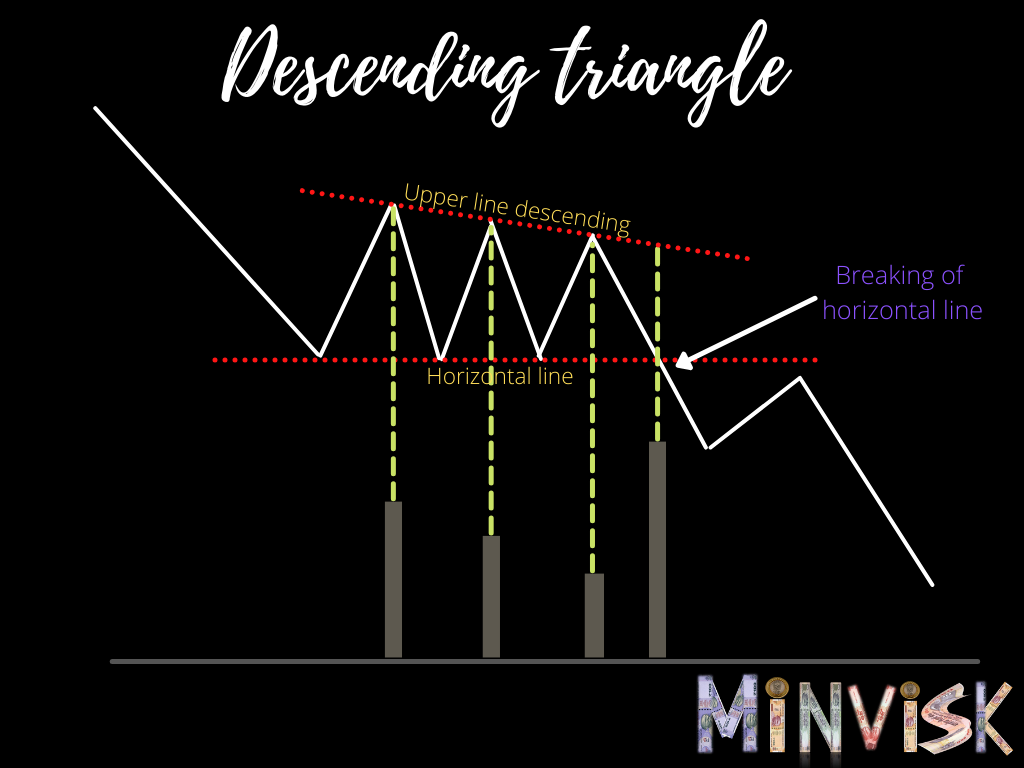
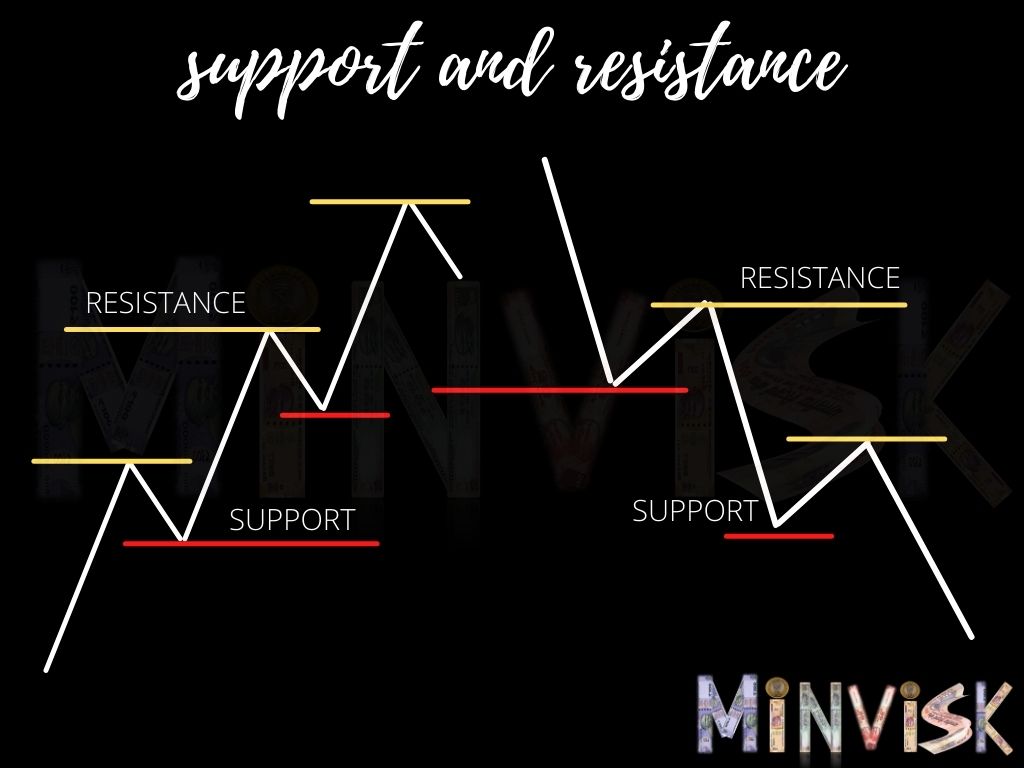
This pattern mainly occurs during a downtrend, indicating the continuation of the downtrend. This pattern is bearish, as selling pressure is greater than buying pressure. This pattern consists of two lines. First, the descending line acts as resistance, and second, the horizontal line acts as a support line. The volume acts in the same pattern as in the symmetrical triangle, volume keeps on decreasing on average as we continue with the chart and there is a sudden breakout of volume as a price break the horizontal line (support line) and when this happens our pattern is complete.
As this pattern is bearish, the volume should be heavier on troughs and lighter on peaks or bounces, as selling pressure is greater than buying pressure.
NOTE: If such a pattern occurs during an uptrend, it can act as a trend reversal. Here the interesting thing, how the continuation pattern can also be used as a trend reversal.


