This strategy is popular among traders, despite contradicting some basic principles of investing. Interestingly, however, this approach has proven to yield decent returns in the short run. Richard Driehaus, regarded as the father of momentum investing, was among the earliest to adopt this strategy. Let’s delve deeper into this methodology and understand how it operates.
WHAT IS MOMENTUM?
Momentum, in the context of trading, can be likened to the speed or velocity at which a stock’s price moves. To grasp this concept better, we can draw a parallel with a car: just as a car gains speed as it accelerates, a stock’s price gains momentum as it moves in an uptrend. Conversely, the analogy holds during a downtrend. It’s essential to note that while trends are generally considered favorable, employing this strategy over an extended period (a longer time-frame) can turn the trend into an adversary.
THE BASIC FOUNDATION
This strategy is grounded in the belief that there exists a positive correlation between past and future stock prices. It allows us to gauge the predictability of a share’s price in the upcoming future.
Primarily, this approach capitalizes on short-term momentum and long-term reversals in the market. Short-term momentum, typically spanning 6, 12, or 15 months, involves making profits by leveraging the momentum for a brief period. Long-term reversals occur when a stock’s price has surpassed expectations for an extended duration and starts to reverse its trend—shifting from an uptrend to a downtrend or vice versa. This reversal could be triggered by announcements, events, or a significant decline in sales volume. Traders and investors need to exercise caution during major reversals. Various reversal patterns, such as head and shoulders, double tops and bottoms, and triple tops and bottoms, can be employed to identify these shifts. It’s worth noting that reversals take time, much like gradually stopping or slowing down a car before changing its direction.
EXECUTING THE STRATEGY
To implement this strategy, traders employ various techniques. Some utilize moving averages or Bollinger Bands, while others rely on simple decile or quartile techniques. Certain hedge funds also adopt this strategy to hedge portfolios, going long (purchasing) on a basket of shares with high price momentum and short (selling) the basket with low price momentum.
Let’s explore how this strategy can be executed. With approximately 1400 companies listed on the NSE (rounded figure, not exact), the first step involves ranking these companies based on their momentum. The common formula used for calculating momentum is:
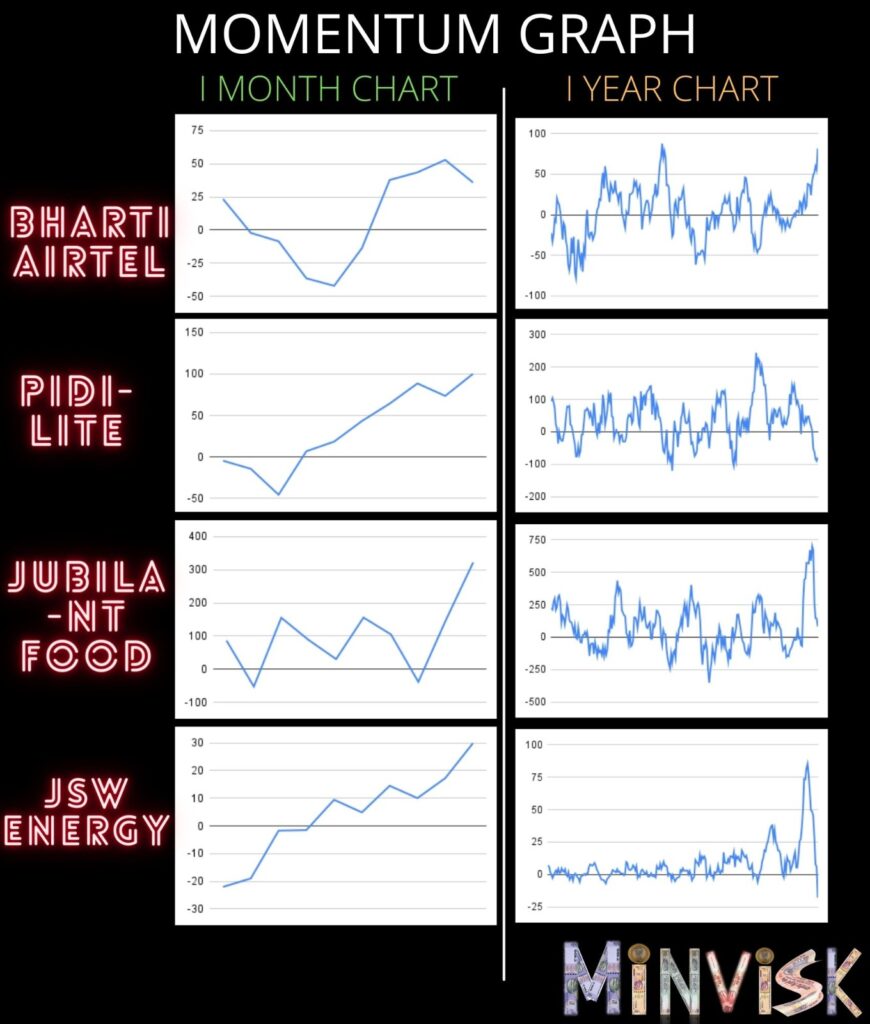
Momentum = Today’s Price − 10-Day Previous Close Price
By plotting this on a line chart, one can easily assess whether the price is exhibiting momentum.
Taking a real-world example in the current market conditions, we’ve identified four momentum stocks:
- Airtel
- Pidilite
- Jubilant Food
- JSW Energy
You can see the momentum of the stocks in the image below

However, certain precautions should be considered when employing this strategy:
- It tends to work better with mid-cap shares compared to large or small-caps.
- Stocks should not be heavily held by large institutions but rather by a large number of individual or retail investors.
- Optimal results are observed with stocks that have low analyst coverage.
It’s noteworthy that good momentum stocks often deliver remarkable returns during economic expansion, while low momentum stocks tend to provide decent returns during recessions. Consequently, the momentum strategy may not be as effective during economic downturns. Additionally, this strategy can be combined with moving averages indicators, as commonly practiced by professional traders.


Hi there, just became aware of your blog through Google, and found that it’s truly informative. I am going to watch out for brussels. I will be grateful if you continue this in future. Numerous people will be benefited from your writing. Cheers!